
Which kinds of work make money
One report answering which kinds of work make money: the jobs you finished in a period, grouped by type, with revenue, cost and margin added up — worst first — and what each was quoted at.
SMG Tools has always known every job’s margin — revenue against labor at true cost, materials, expenses and the machine — and every job’s type. The Projected vs Actual page lists them. What no page said was the sentence you actually wanted: water heaters run 41%, drain cleaning runs 18%, and the gutter work I keep saying yes to loses money.
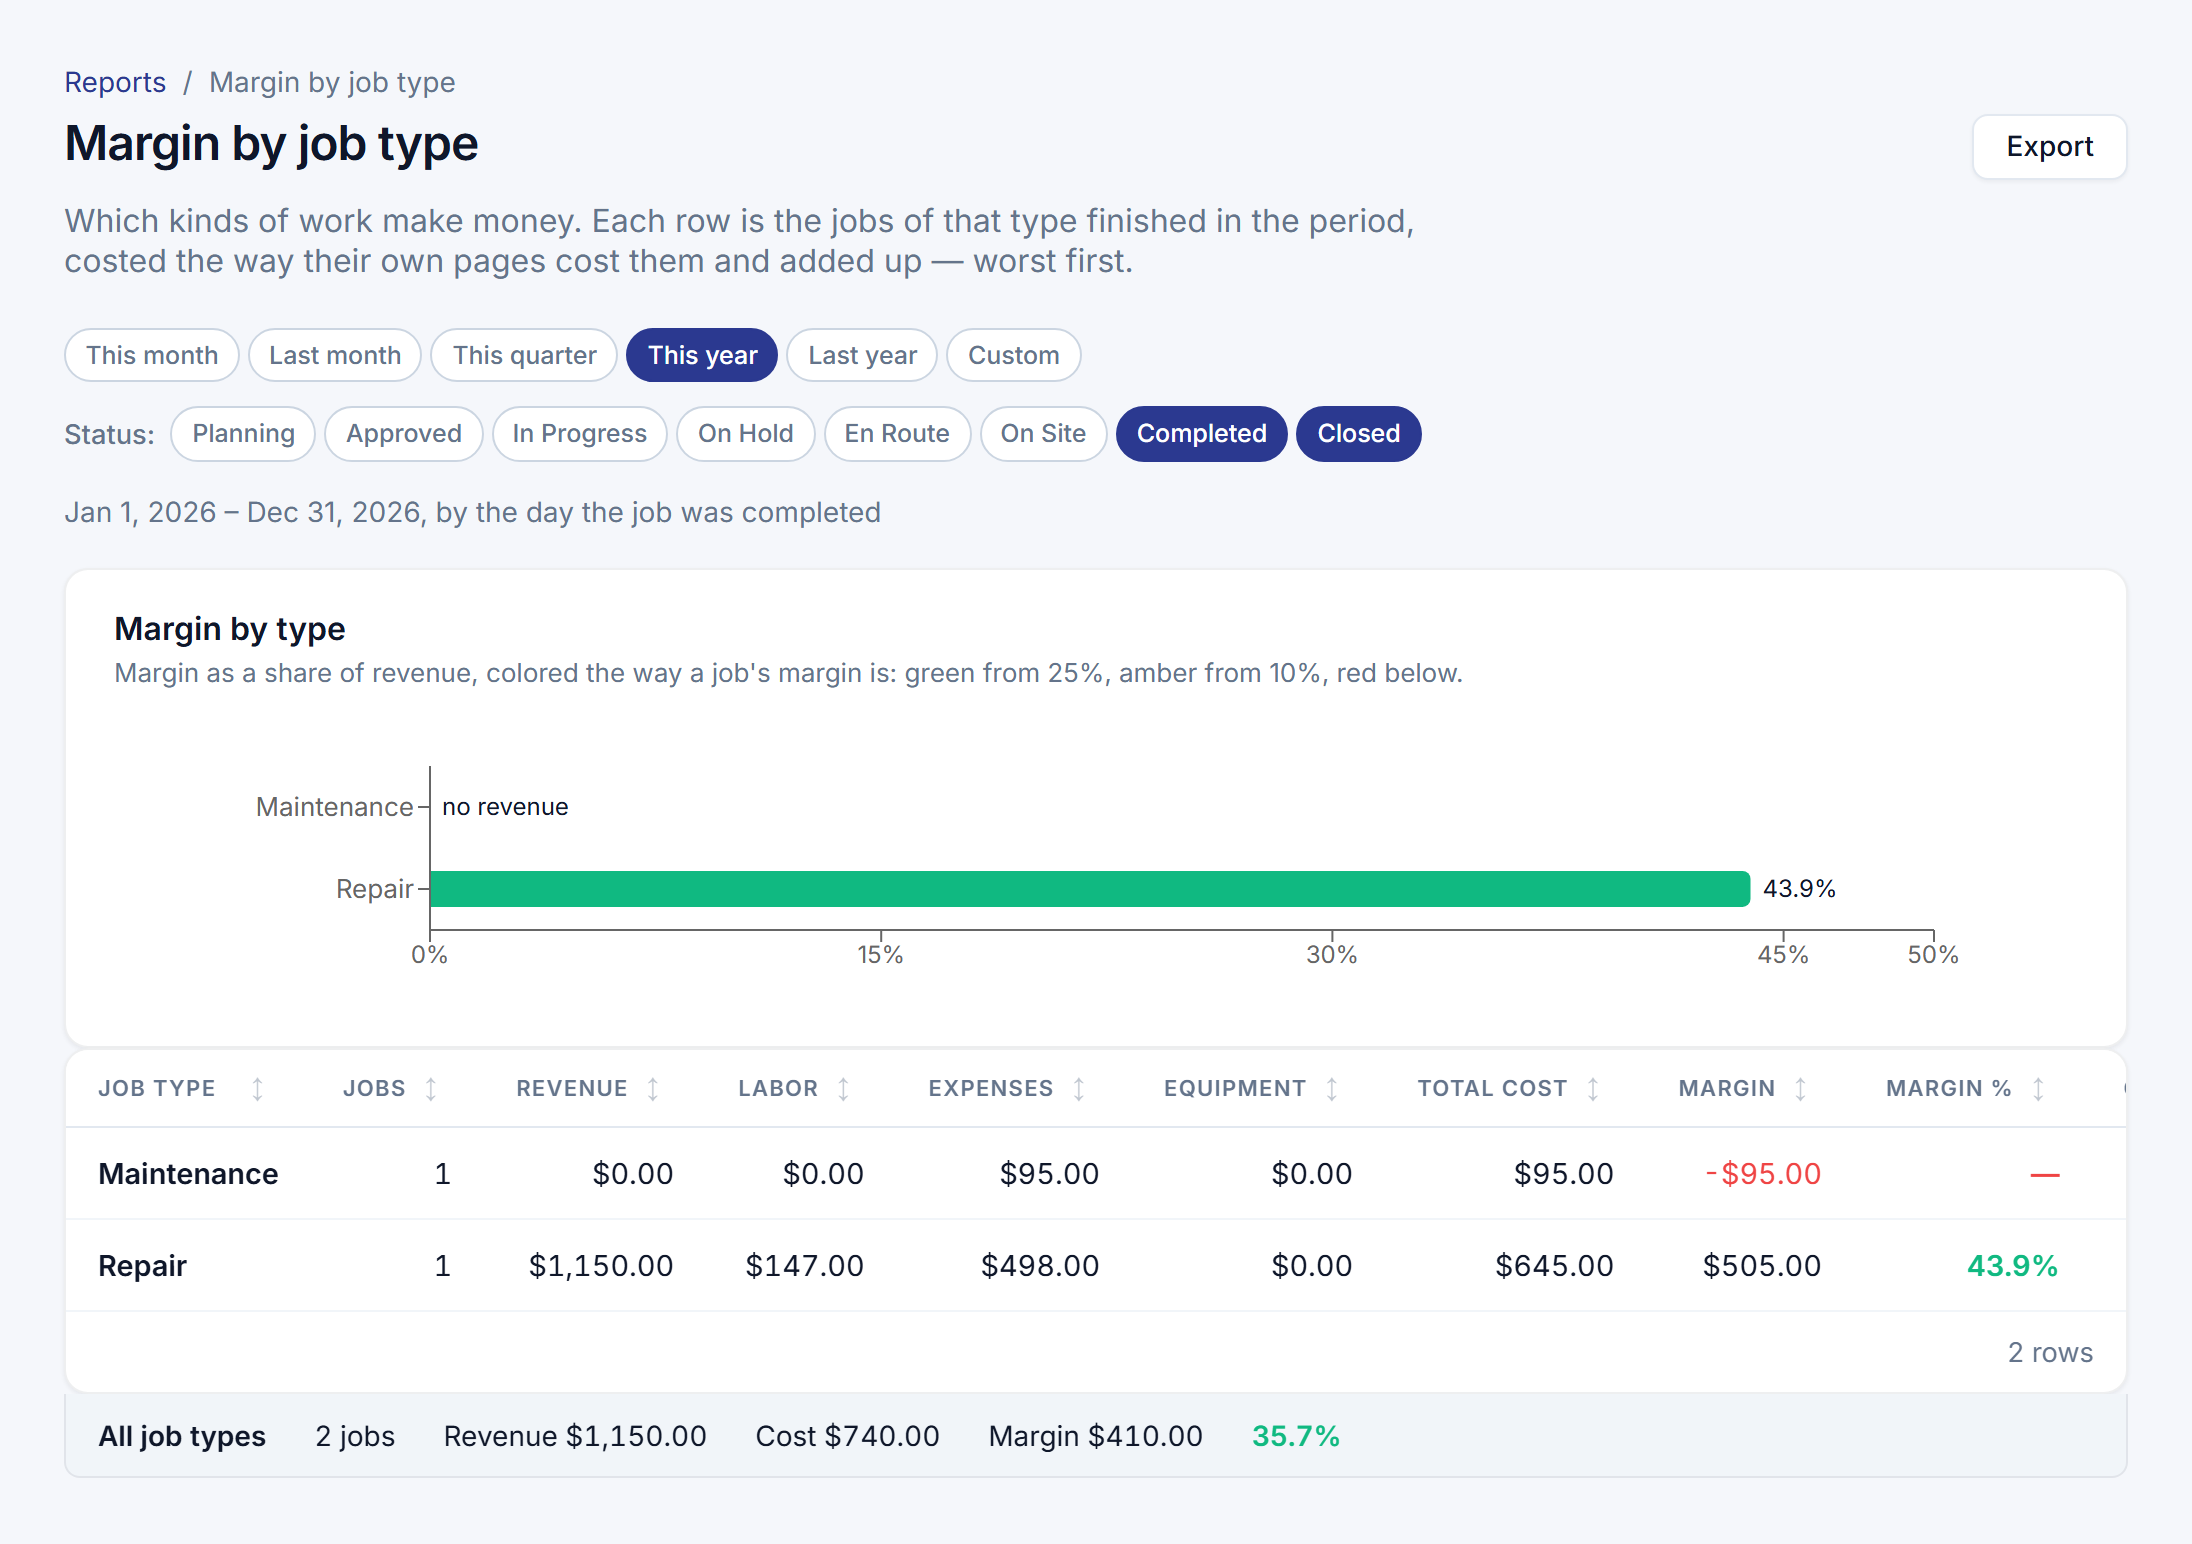
One report, one grouping. Margin by job type, under Reports: pick a period — this month, last month, this quarter, this year, last year, or your own dates — and each kind of work you finished in it is one row: how many jobs, revenue, labor, expenses, equipment, total cost, margin in dollars and as a share of revenue. Sorted worst first, because the row losing money is the reason to open the page. A bar per type beside the table, in the same green, amber and red a job’s own margin wears.
What it was quoted at. Where a type’s jobs were estimated, the row also shows the margin those jobs were quoted at against the margin they came in at, and how many of the type’s jobs that covers — the estimate-accuracy question, asked by kind of work.
The same numbers as the job. Nothing is recalculated. Each row is the jobs of that type, costed exactly the way their own pages cost them, added up. Click a row and the Projected vs Actual page opens filtered to that type and period, with the jobs that made the figure listed one by one. Export downloads the table as a CSV.
A job counts in the period it was finished. A job created in March and completed in May is May’s margin.
Owners and Managers, on every plan. When a margin alert names a job, the Margin Intelligence settings now point here — the place to see whether the drift is one job or a kind of work.