
Comparing jobs against their estimates
One report across every job — which are healthy, which are bleeding money, and how each is tracking against what it was quoted at.
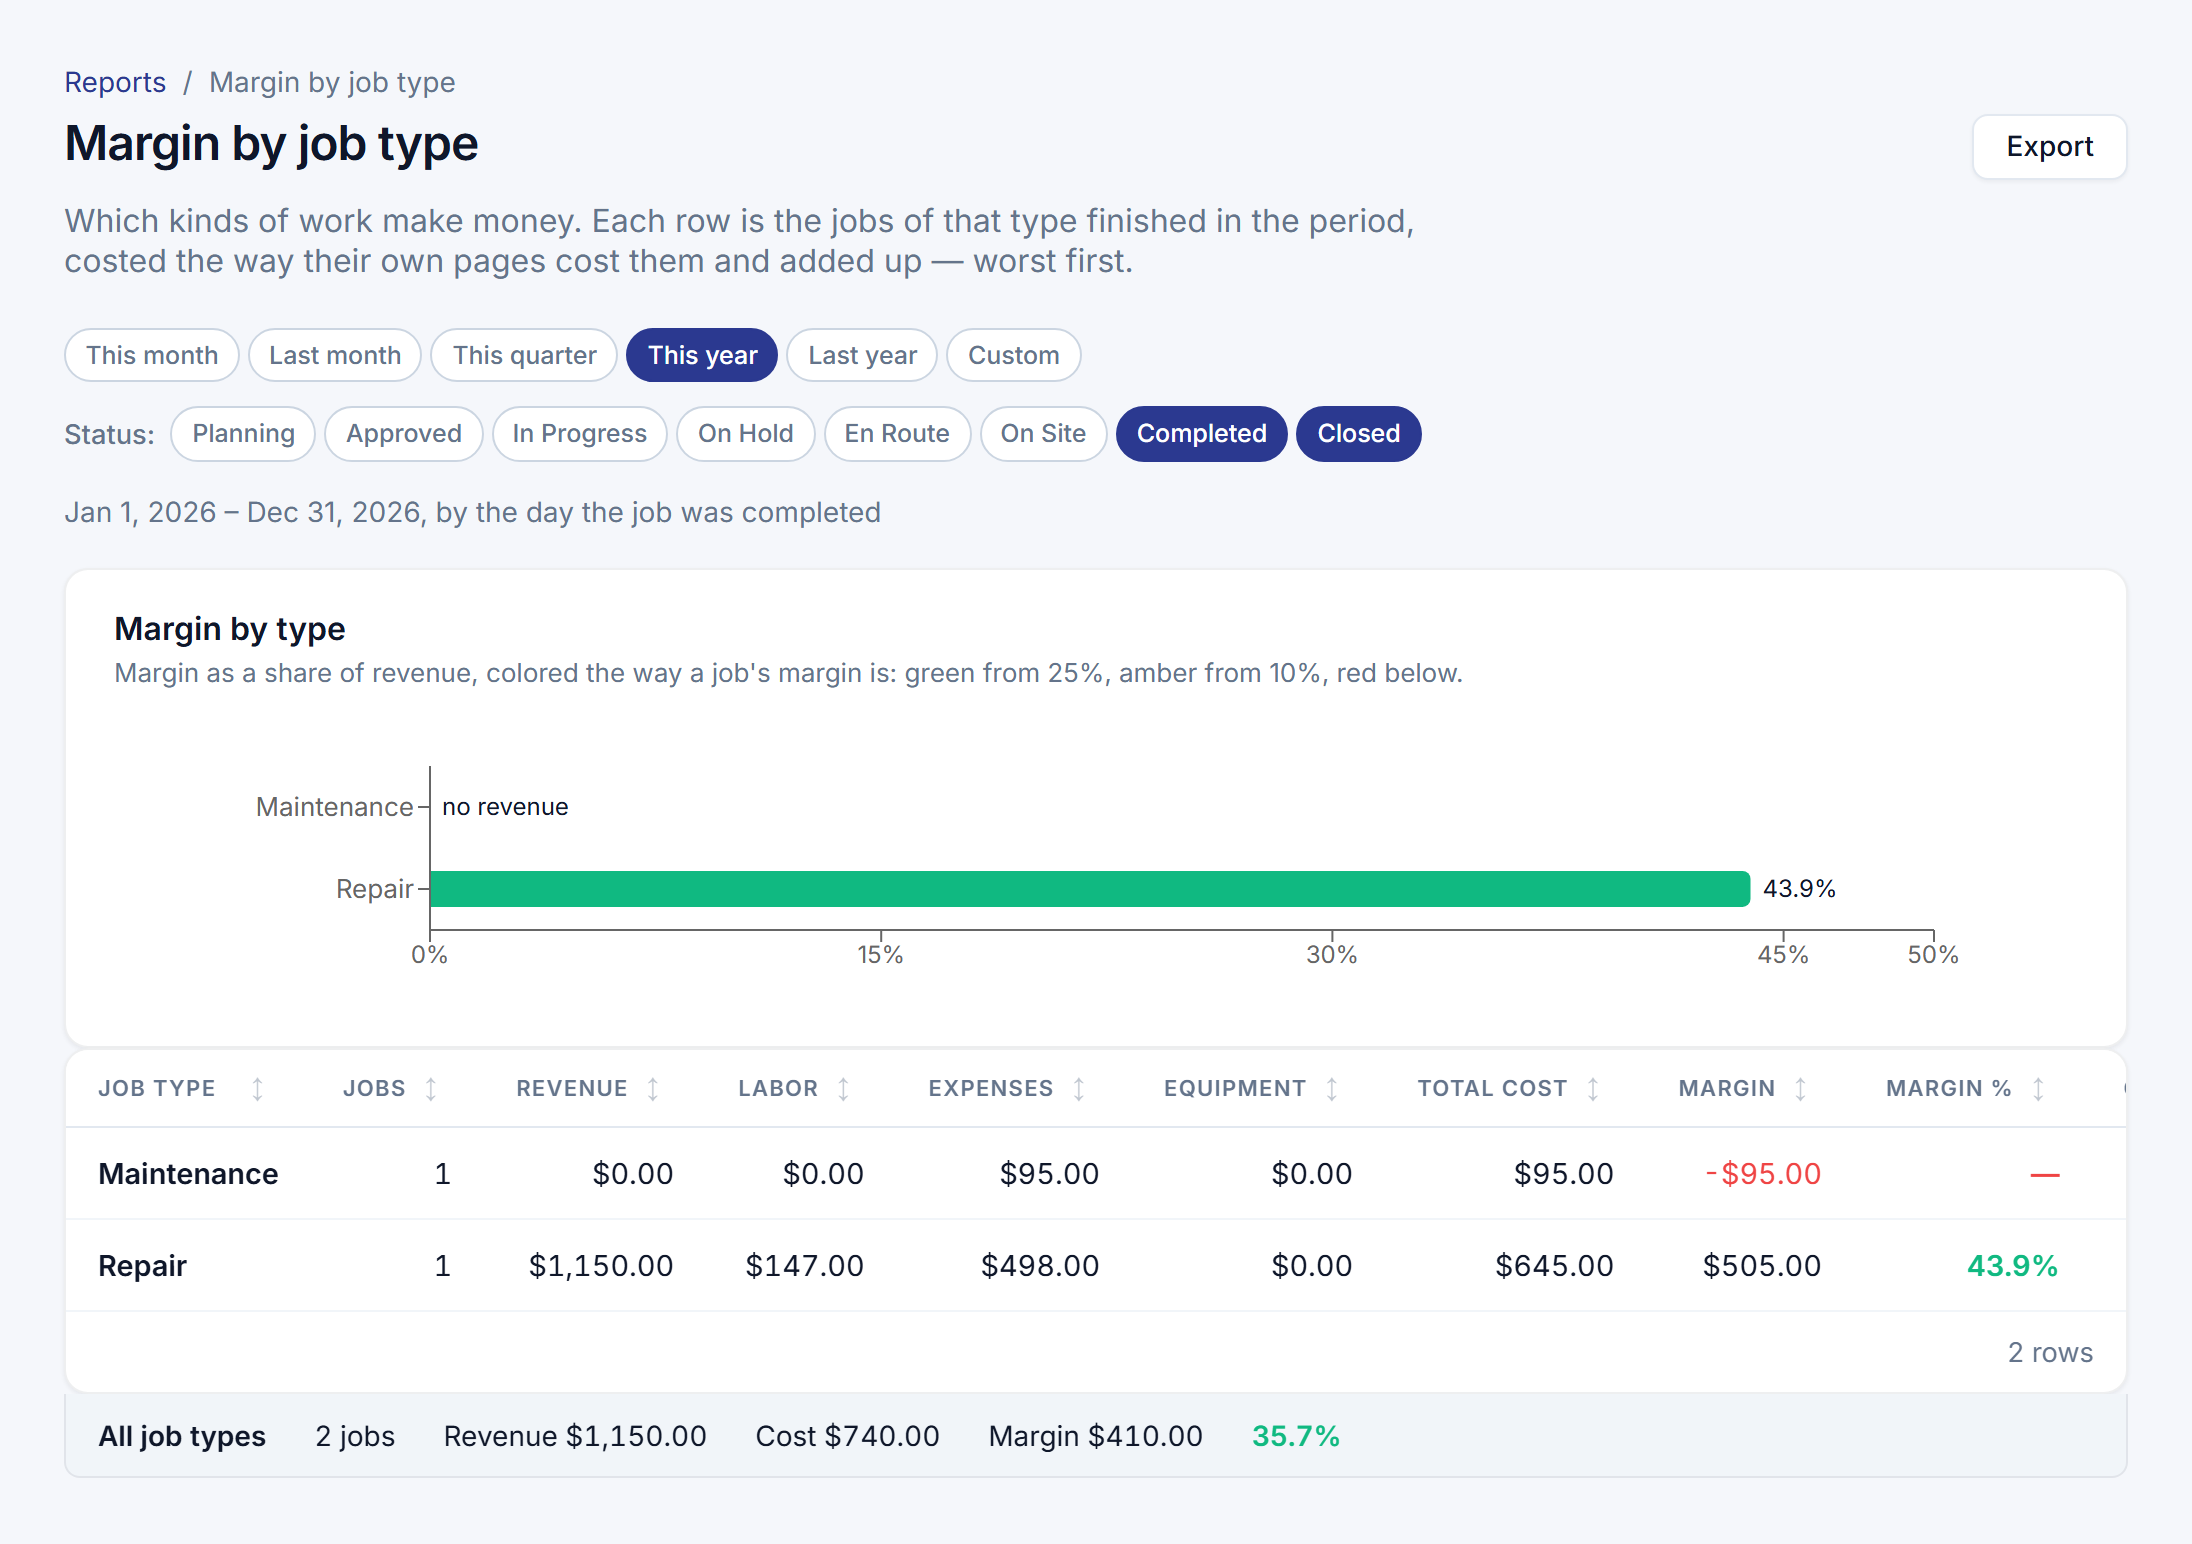
Job costing tells you about one job. This report answers the question above it: which of my jobs are healthy, and which ones are losing money? It compares every job against what it was estimated at, in one place.
Find it
It lives under Reports → Job costing. There are shortcuts to it from the At-risk jobs widget on your dashboard and from the toolbar on the Jobs list, which are the two places you are most likely to be when the question occurs to you.
Read it across jobs
Each row is a job with its estimated figures, its actual figures and the gap between them. Active jobs are the default, and you can include completed ones when you are reviewing a period rather than managing today.
The value is in the comparison. A single job 12% over is a conversation; four jobs of the same kind all 12% over is a pricing problem, and only a view across jobs shows you that.
Understand the columns
The estimate comes from the job’s frozen baseline — what it was quoted at — and the actuals come from the hours logged, the expenses recorded and the equipment used, each at the rate it carried at the time.
While a job is still running there is a projected figure as well: what has been spent so far plus what is left of the estimate. That is the column that tells you a job is going wrong while there is still time to do something.
For what each of those numbers is built from, see Job costing and margins.
This page describes Projected vs Actual Dashboard. It is written from that feature’s record and covers what has shipped, never what is planned.